Summary of results of the mirke neighbourhood survey
Here you can find a summary of the results of the mirke neighbourhood survey. The survey looks at the housing, working and living realities of the residents as well as their ideas and wishes for a liveable neighbourhood. It thus provides important insights for the municipal planning of the City of Wuppertal, the work of local initiatives and associations as well as the university teams participating in the SDE21/22. We would like to thank all participants to date and hope you enjoy reading the results.
First survey round, summer 2021
In April and July 2021, all households in the Mirke Neighbourhood received a postal invitation to the Neighbourhood Survey from the City of Wuppertal. A total of 1023 people responded and registered for the Mirke Neighbourhood Survey. Almost half of these (505 people; response rate: 49.4%) then took part in the first survey round in September/October 2021.
In order to check the representativeness of the group of participants for the Mirk neighbourhood, the data was compared with official statistics and then weighted according to gender, age and migration background. This means that the responses of certain population groups are given more weight to ensure overall representativeness. The results presented on this page show the weighted data.
To the detailed survey results (PDF)
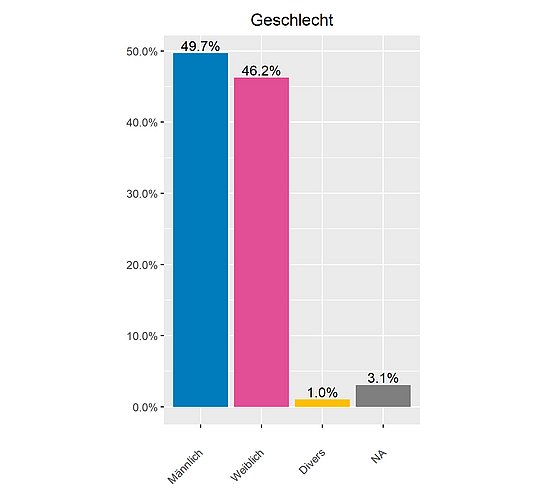
Gender © SDE 21/22
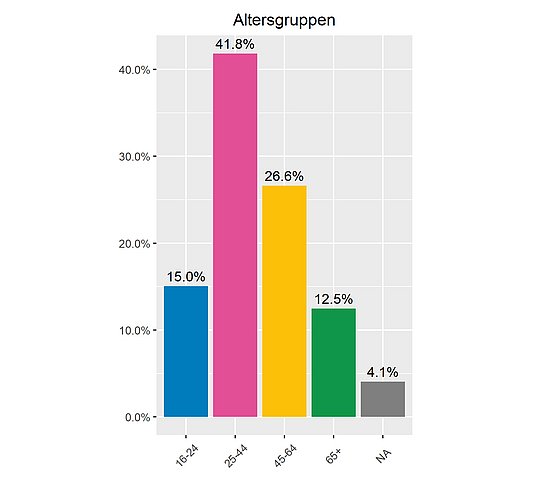
© Age groups SDE 21/22
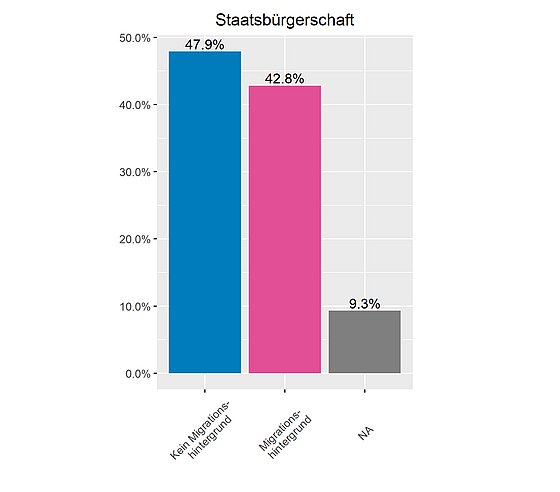
Citizenship © SDE 21/22
Life in the mirke neighbourhood
Overall, the participants feel more connected to the Mirke district (36.6%). The proportion of respondents who feel little or no connection to the neighbourhood is significantly lower (7.8%). When asked whether they like living in the Mirk neighbourhood, the majority of participants expressed (very) strong agreement (91.1%).
As an introduction to the questionnaire, the participants were invited to write down the first three images, things or words that come to mind about the Mirke district. These free associations could be assigned to a total of 13 overarching categories (ordered by frequency of mention):
- Places, buildings & actors (35% of the mentions), e.g.: Utopiastadt / Mirker Bahnhof, Nordbahntrasse, Café ADA
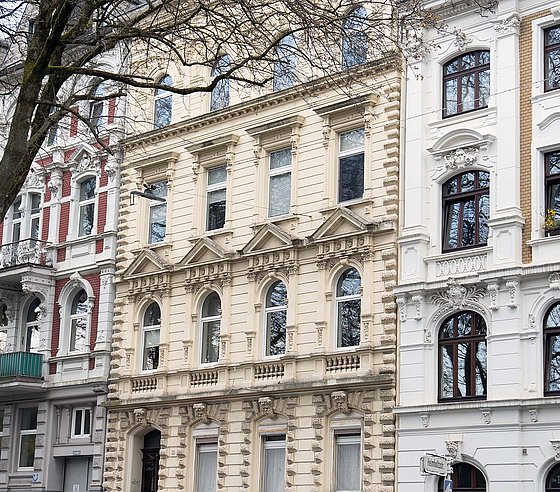
- Cityscape (14.4%), e.g. beautiful Wilhelminian architecture, steep streets, dense population, view of the valley
- Population (11%), e.g. diversity, colourful neighbourhood, families, students, many different people
- General positive impressions / descriptions (8%), e.g. nice residential area, relaxed atmosphere, lively, alternative, liveable
- Problems around transport infrastructure & mobility (5.8%), e.g. lack of parking spaces, too few cycle paths, lots of traffic
- Traffic connections and location in the city (4.4%), e.g. central location, good connections, direct access to railway lines
- Problems, negative changes & concerns (4%), e.g. gentrification, poverty, vacancy, too many visitors, too little space
- Emotional / personal connection to the neighbourhood (4%), e.g. my home, home, childhood, 'my' district
- Leisure facilities and offers (3.9%), e.g. diverse cultural offers, art, music, cosy cafés, bars and restaurants
- Living together and commitment (3.5%), e.g. good neighbourhood, community, great people, commitment of residents, cohesion.
- Lack of cleanliness (2.3%), e.g. dirty house fronts, rubbish, dog excrement
- Positive development of the neighbourhood (2.2%), e.g. neighbourhood on the move, many new, good projects, lots of potential
- Noise pollution (1.4%), e.g. noise from the A46 motorway
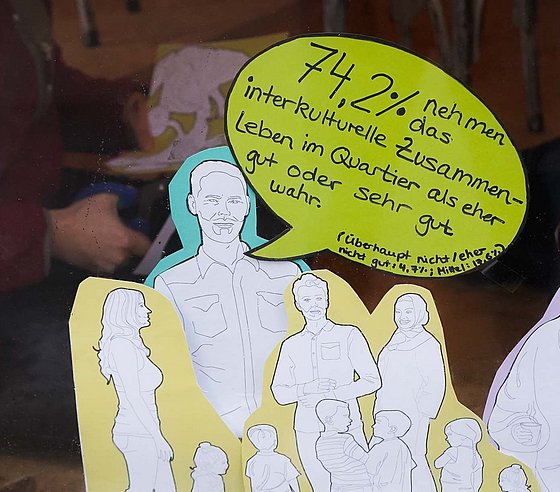
In order to capture the coexistence in the neighbourhood, the participants were asked about their assessment of intercultural coexistence, social cohesion, social differences and their neighbourhood relations. The majority of respondents rated both intercultural coexistence in the neighbourhood (rather good/very good: 74.2%) and social cohesion positively (rather good/very good: 50.6%). However, the social differences are perceived as rather large (31.2%) or very large (5.9%).
In terms of neighbourly relations, the participants describe the contact with their neighbours and fellow residents in the neighbourhood predominantly as rather close ("I know some of the neighbours more closely and people help each other out sometimes". - 43%) or even very close ("I maintain friendships with some neighbours" - 23%). Few people rated their neighbourly relations as not close ("I don't know anyone in the neighbourhood personally and I don't say hello to them either" - 1.3%).
The questionnaire also asked how satisfied the participants were with various aspects of their living environment. In particular, they rated the public transport connections, the local recreational opportunities and the range of cafés, restaurants and bars as positive. On the other hand, the parking facilities for cars, the cleanliness of the neighbourhood and the provision of care and old people's facilities were rated as particularly negative.
Participants were invited to select up to seven factors affecting their living environment from a list and rank them according to their personal importance. The following aspects received the highest overall score (i.e. they were most frequently selected as one of the seven most important factors and received a higher rating within the seven factors): Accessibility to public transport, local supply and shopping facilities, and neighbourhood and social environment.
Mirker Bahnhof © Wolf Sondermann
© SDE 21/22
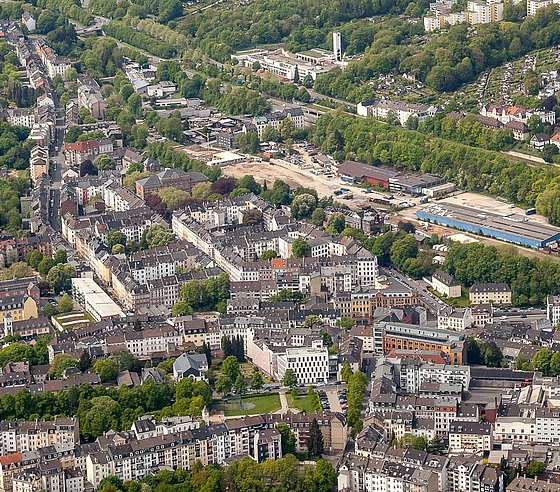
Mirke District © Wolf Sondermann
Mobility
The majority of the participants state that they have a driving licence themselves (77%). In addition, 46.8% say they always have access to a car (sometimes: 11.9%; never: 13.8%) and 68.2% have at least one car in their household. In contrast, only a small proportion of respondents (14%) are members of a car-sharing provider.
In terms of transport use, car use in the Mirk neighbourhood is relatively balanced: While 48% of respondents said they used their car daily or several times a week, the same proportion said they rarely or never relied on their car. Car sharing was again not used by the majority (73%).
Public transport was used frequently (daily or several times a week) by 38% of the participants at the time of the survey. However, a large proportion of respondents also stated that they rarely (35.4%) or never (21.3%) used public transport. Walking, on the other hand, was much more common: Around 81% stated in the survey that they covered distances exclusively on foot every day or several times a week.
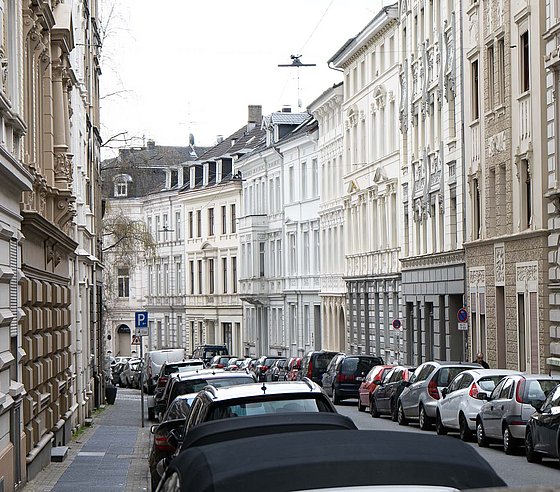
Parking in the Mirke district © SDE 21/22

© Orkun Azap | Unsplash
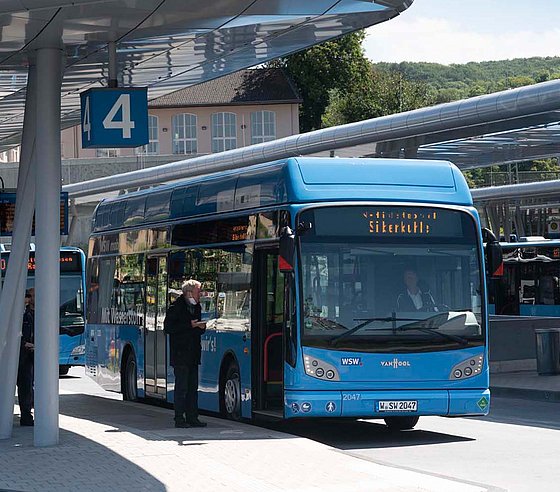
© WSW
Living in the Mirke district
A pronounced majority of respondents stated that they currently live in a rented flat (80.9%) and less frequently in a condominium (16.5%). The average number of rooms is 2.8 rooms and the average living space per person is 47.1 m².
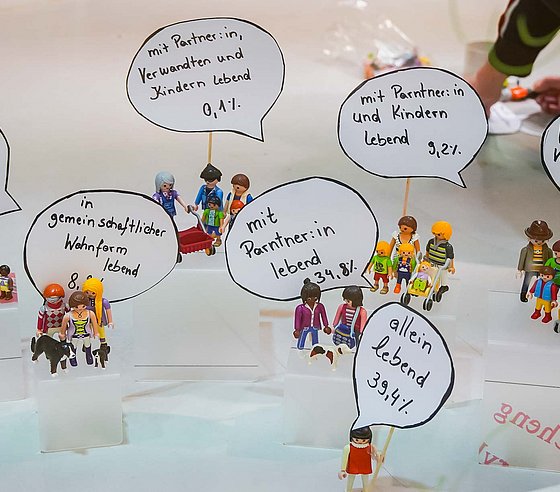
Most of the participants live on this living space alone (40.2%) or with another household member (37.8%). Significantly fewer live with (more than) two other people (18.7%). Most of the flatmates are their own partner (34.8%) and/or children (11.7%). A further 8.9% live in a traditional shared apartment and another 2.25% with other relatives.
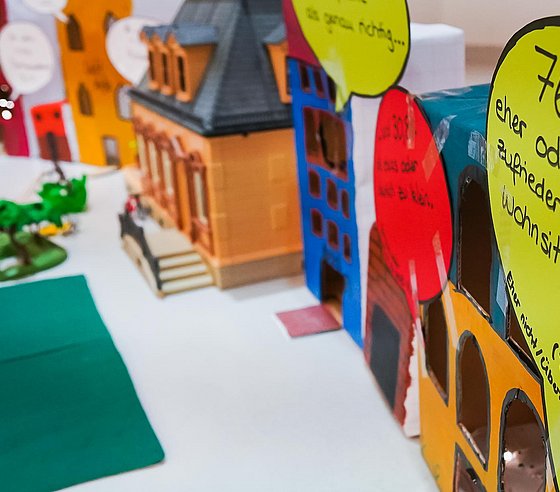
The majority of respondents are (very) satisfied with their housing situation (76.5%) or have a neutral attitude in this respect (18.4%). Only a very small proportion stated that they were (very) dissatisfied with their housing situation (4%). The majority of the participants felt that the size of the flat was just right (55.7%) or tended to feel that it was rather/much too small (30.8%). A minority of the participants felt that their living space was somewhat/much too large (11.4%).
Around half of the respondents (42.3%) had no plans to move at the time of the survey. A further 27.9% said they had no specific plans to move and 8.1% had specific plans. With regard to their housing preferences, a clear majority also wanted to stay in their current flat (43.4%), in the Mirke (15%) or in Wuppertal (8.7%). Only a few participants said they wanted to move to a city of the same size (0.3%), a larger (2.2%) or smaller city (2.4%) or to the countryside (5.4%).
Next, the respondents were asked to imagine they would move now: What factors would be most important to them in choosing their living space? The participants were invited to choose up to seven factors that affect their living space from a list and to rank them according to their personal importance. This showed that a suitable flat size, a balcony/terrace and a good house community were most important to the participants when choosing their living space. A guest room and accessibility, on the other hand, were particularly important to the fewest participants.
© SDE 21/22
© SDE 21/22
© SDE 21/22
Experience with the Corona pandemic
The Corona pandemic did not lead to any changes in the areas of neighbourhood, housing and mobility for a large part of the participants (40%, 47.8% and 50.1%). In the areas of neighbourhood, housing and work, the changes were perceived as rather/very positive by about a quarter of the respondents (26.8%, 22.5% and 28.4%). In the areas of mobility, leisure & recreation and shopping & consumer behaviour, on the other hand, mixed pictures emerged (mobility: rather/strongly negative: 15.9%, rather/strongly positive: 15.6%; leisure & recreation: rather/strongly negative: 31.9%, rather/strongly positive: 26.7%; shopping & consumer behaviour: rather/strongly negative: 16.2%, rather/strongly positive: 22%).
Due to the new working situations that have arisen in many places as a result of the Corona pandemic, home office was also considered in the first round of the survey. This showed that 30.6% of the participants could in principle do all or part of their work at home, but for a further 22.9% this was not an option (46.6% abstentions). Of the participants who were already working in a home office at the time of the survey, 17.5% stated that they currently spend 75-100% of their working time in a home office. A 50% rule would be ideal for most in this respect.
Attitudes & Behaviour
Environmental awareness is generally (very) high (80.4%) among respondents in the Mirk neighbourhood. Around half (55.6%) would also welcome a renovation of their living space. A majority of the respondents (66.1%) also (strongly) agreed with the statement that a climate-neutral building stock is important in order to achieve the national climate goals. In contrast, a reduction in the size of one's own living space is perceived by most as being secondary to climate protection: 28.5% agreed rather/fully that housing sufficiency is an important contribution to climate protection. At the same time, 32.3% disagreed/strongly disagreed with this statement.
Demographic data
The survey participants were asked about their current marital status. A large majority stated that they were currently single (66.1%) or in a marriage or registered partnership (21.2%). Only a small proportion of participants are currently divorced (5.7%) or widowed (2.1%).
The majority of the participants have either a university education (tertiary level; 43.5%) or a (higher) secondary education (upper secondary level; 43.5%). Only a few of the respondents, on the other hand, stated that they had a primary or lower secondary degree (7.4%).
As part of the survey, the financial situation and self-assessment of the household's economic situation was also looked at more closely. The monthly net household income of the majority of respondents is between 2000€ and 4000€ (38.6%) or between 1000€ and 2000€ (22.4%). 68.9% of the participants also assess the current economic situation of their household as (very) good (compared to 5.9% as '(very) bad' and 18.4% as 'partly good, partly bad'). However, when looking ahead to the economic situation of the household in one year's time, this percentage is reduced (good/very good: 30.5%; partly good, partly bad: 53.4%; bad/very bad: 6.8%).
Most respondents have lived in Wuppertal for more than twenty years (52.4%). Only a few (11.4%) have lived in the city for two years or less. The picture is different for the Mirke neighbourhood: 21.4% of the participants have lived in the neighbourhood for more than 20 years; at the same time, a larger proportion has lived here for less than two years (26%). A similar distribution as in Mirke emerges for the length of residence in the current accommodation.